Author: Kazi Abu Rousan
Bottomless wonders spring from simple rules, which are repeated without end.
Benoit Mandelbrot
Today, we will be discussing the idea for making a simple Mandelbrot Set using python's Matplotlib. This blog will not show you some crazy color scheme or such. But rather the most simple thing you can make from a simple code. So, Let's begin our discussion by understanding what is a Mandelbrot Set.
In the most simple terms, The Mandelbrot set is the set of all complex numbers c for which the function $f_c(z) = z^2 + c$ doesn't goes to infinity when iterated from $z=0$.
Let's try to understand it using a example.
Suppose, we have a number $c = 1$, then to $ f_c(z)=f_1(z)= z^2 + 1 $.
Then, we first take $z_1 = f_1(z=0)=1$, after this we again calculate $z_2 = f_1(f_1(0)) = 1^2 + 1 = 2$, and so on. This goes on, i.e, we are getting new z values from the old one using $z_{n+1} = {z_n }^2 + 1$. This generates the series $0,1,2,5,26,\cdots$. As you can see, each element of this series goes to infinity, so the number $1$ is not an element of mandelbrot set.
Similarly, if we take $c=-1$, then the series is $0,-1,0.-1,0,\cdots$. This is a oscillating series and hence it will never grow towards infinity. Hence, the number $-1$ is an element of this set.
I hope this idea is now clear. It should be clear that $c$ can be any imaginary number. There is no restriction that says that $c$ must be real. So, is the number $c=i$ inside the set? Try it!!
Let's take a point $c = x+iy = P(x,y)$. So, the first point is $z_0 = 0+i\cdot 0 \to x = 0$ and $y=0$, i.e., we start the iteration from $f_c{z=0}$. Now, if at some point of iteration $|z_n|\geq 2$, then the corresponding $c$ value will not be inside the set. But if $|z|<2$, then corresponding c is inside the set.
Try this idea by hand for new numbers.
Now, let's check few numbers using a simple python code.
import numpy as np
def in_mandel(c,max_ita=1000):
    z = 0
    for i in range(max_ita):
        z = z**2 + c
        if abs(z)>=2:
            print(c," is not inside mandelbrot set upto a check of ",(i+1))
            break
        if i==max_ita-1 and abs(z)<2:
            print(c," is inside mandelbrot set upto a check of ",max_ita)
c1 = 1
in_mandel(c1)
#Output = 1  is not inside mandelbrot set
c2 = -1
in_mandel(c2)
#Output = -1  is inside mandelbrot set upto a check of  1000
c3 = 0.5+0.4j
in_mandel(c3)
#output = (0.5+0.4j)  is not inside mandelbrot set
You see how easy the code is!!, you can try out this geogebra version of you want - Check it here: Geogebra
Now, Let's plot one. We will be using a simple rule.
import matplotlib.pyplot as plt
import numpy as np
max_ita = 1000 # number of interations
div = 1000 # divisions
c = np.linspace(-2,2,div)[:,np.newaxis] + 1j*np.linspace(-2,2,div)[np.newaxis,:]
z = 0
for n in range(0,max_ita):
      z = z**2 + c
p = c[abs(z) < 2]#omit z which diverge
plt.scatter(p.real, p.imag, color = "black" )
plt.xlabel("Real")
plt.grid(color='purple',linestyle='--')
plt.ylabel("i (imaginary)")
plt.xlim(-2,2)
plt.ylim(-1.5,1.5)
plt.show()
The output is:

This is not as good as the plots you normally see in internet like the images given below. But this one serves the purpose to show the shape of the set.


Let's try to make a bit fancier one.
The code is given here:
import matplotlib.pyplot as plt
import numpy as np
max_ita = 1000
div = 1000
c = np.linspace(-2,2,div)[:,np.newaxis] + 1j*np.linspace(-2,2,div)[np.newaxis,:]
ones = np.ones(np.shape(c), np.int)
color = ones * max_ita + 5
z = 0
for n in range(0,max_ita):
      z = z**2 + c
      diverged = np.abs(z)>2
      color[diverged] = np.minimum(color[diverged], ones[diverged]*n)
plt.contourf(c.real, c.imag, color)
plt.xlabel("Real($c$)")
plt.ylabel("Imag($c$)")
plt.xlim(-2,2)
plt.ylim(-1.5,1.5)
plt.show()
Here is the output:
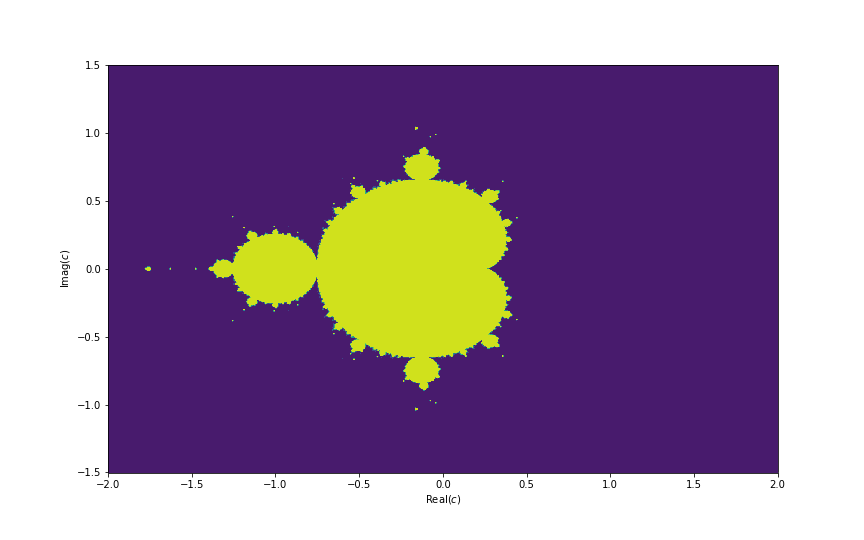
Beautiful isn't it?, This set has many mystery. Like you can find the value of $\pi$ and Fibonacci number from it. It is also hidden in Bifurcation diagram and hence related to chaos theory.

But we will live all these mysteries for some later time. This is all for today. I hope you have enjoyed this and if you have, then don't forget to share.