Author: Kazi Abu Rousan
Pi is not merely the ubiquitous factor in high school geometry problems; it is stitched across the whole tapestry of mathematics, not just geometry’s little corner of it.
$\pi$ is truly one of the most fascinating things exist in mathematics. It's not just there in geometry, but it's also there in pendulum, waves, quantum particles, integrations, probability and even in biology.
Today we will be seeing one of the places where it arises in probability.
The name "Monte Carlo" refers to the city in Monaco which is known for it's casinos and gambling. So, Monte Carlo is basically used as a symbol of randomness.
Monte Carlo's Method or Monte Carlo experiments, are a broad class of computational algorithms that rely on repeated random sampling to obtain numerical results. The underlying concept is to use randomness to solve problems that might be deterministic in principle.
We will be using one of those experiment to find value $\pi$.
Let's start from the basics.
Suppose, we have a line from $0$ to $5$ unit and we throw a dot at random. The question is: What is the probability that the dot will be on the line between $2$ to $3$ unit?
The answer is : $\frac{1}{5}$
Why?, because the probability is simply $\frac{length\ of\ favorable\ region}{length\ of\ whole\ region}$.
Now, suppose we have a circle inside a square as shown in the figure.
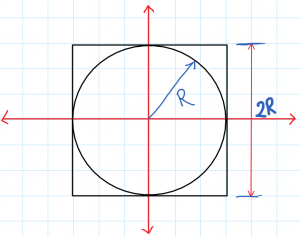
We now throw a ball at random inside the square. What is the probability that the ball will land inside the circle?, The answer is simply the ratio of the areas of the favorable region and the total region (here we are using the area as it is a two-dimensional region).
This simply means;
$$ P = \frac{Area\ of\ Green\ Region}{Area\ of\ Blue\ Region} $$

So, $$P = \frac{\pi R^2}{4\times R^2} = \frac{\pi}{4}\to \pi = 4\times P $$
Now, the question is how to find the value of $P$?
Well, we can just use the Experimental definition of probability. This definition simply says "The probability is equals to the ratio of number of events whose results are favorable and the total number of experiments done.
In our case, It simply means $P = \frac{No. \ of\ balls\ which\ are\ fallen\ inside\ circle}{Total\ No.\ of\ balls\ thrown}$
This exact idea can be used to write a program to find the value of $\pi $.
Let's begin our coding.
We will be taking a unit circle. Python's numpy library has many functions to generate random number, we will be using that.
import numpy as np
n = 4
x_vals = np.random.uniform(-1,1,n)
y_vals = np.random.uniform(-1,1,n)
print(x_vals,y_vals)
#Output:[0.83083661 0.40144553 0.07297935 0.21236558] [ 0.30707802 -0.42705451 -0.70296805 -0.44182543]
This block of code generates two arraies (list) containing values between $-1 to 1$. We will use each of those values from x_vals as x-coordinate of each ball and y_vals as y-coordinates of each ball. There $n$ represent number of balls.
Now, we need a function which will check if a ball is inside the circle or not. This is quite easy. We can just find $x^2+y^2$, if it's less than or equals to $1$, then it's inside the circle or else, it's outside.
def check_in_circle(x,y):
	if x**2+y**2<=1:
		return True
	else:
		return False
print(check_in_circle(0.5,0.5))
print(check_in_circle(1,1.2))
#Output: True
False
Now, we will combine all this to write a code and calculate the value of $\pi $.
import numpy as np
import matplotlib.pyplot as plt

n = 100000#also used 4, 10,100etc
x_vals = np.random.uniform(-1,1,n)
y_vals = np.random.uniform(-1,1,n)
coords = np.vstack((x_vals,y_vals)).T

def check_in_circle(coord):
	if coord[0]**2+coord[1]**2<=1:
		return True
	else:
		return False
inside_count = 0
for i in range(n):
	if check_in_circle(coords[i]):
		inside_count += 1
print("Value of pi = ",4*(inside_count/n)," for n = ",n)
#Output: Value of pi =  3.13572  for n =  100000
Value of pi =  3.0  for n =  4
Value of pi =  3.08  for n =  100
Value of pi =  3.1324  for n =  10000
As you can see, the value to $\pi $ from this method approaches it's real value as we increase $n$. Let's see a plot for few values of $n$ (along with code)


The code to generate this is here:
import numpy as np
import matplotlib.pyplot as plt

n = 100000
x_vals = np.random.uniform(-1,1,n)
y_vals = np.random.uniform(-1,1,n)
coords = np.vstack((x_vals,y_vals)).T
inside_x = []; inside_y = []
def check_in_circle(coord):
	if coord[0]**2+coord[1]**2<=1:
		return True
	else:
		return False
for i in range(n):
	if check_in_circle(coords[i]):
		inside_x.append(coords[i][0])
		inside_y.append(coords[i][1])
inside_count = len(inside_x)
pi_val = 4*inside_count/n
figure, axes = plt.subplots()
plt.scatter(x_vals,y_vals,color="BLUE",s=0.1)
plt.scatter(inside_x,inside_y,color="GREEN",s=0.1)
qa = plt.Circle((0,0),1,fill=False, color="RED", linewidth=2)
plt.xlim(-1.01,1.01)
plt.ylim(-1.01,1.01)
axes.set_aspect(1)
axes.add_artist(qa)
plt.title("n=%s and points_inside = %s, $\\pi$ = %s"%(n,inside_count,pi_val))
plt.show()
We can make a video of $\pi $ vs $n$ to see how it converges.
This is all for today. The code for the video can be found here: Code of Animation
I hope you learn something new.